Recycling labels increase campus waste diversion rate by 164%.
Deepti Save
subscriber
The university of Toronto, Mississauga (UTM) discovered that using images on their recycling labels increased their campus waste diversion rate by 164%.
As part of their final capstone project, a team of three Masters of Science-Sustainability Management students at UTM conducted a study to find out whether recycling labels have an impact on diversion rates.
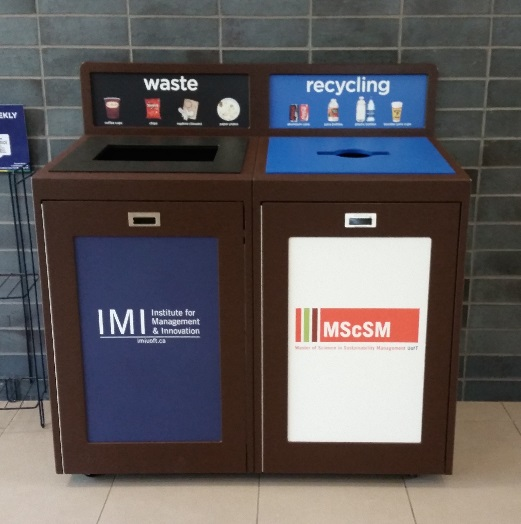
UTM’s current campus waste program collects commingled recycling and landfill waste. There are many recycling containers around campus, particularly in the high traffic areas. The current recycling bins all have text (no images) on the stream labels.
[caption id="attachment_3356" align="aligncenter" width="800"] UTM’s campus recycling bins have text only stream labels.[/caption]
The study team planned to place two recycling containers at high traffic areas on campus. And change out the recycling bin graphics each week to see what impact this had on the campus diversion rate.
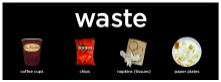
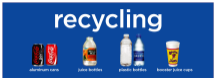
Recycling bin with facility-specific waste images and text
2. Collaborated with the Facilities department.
The study team worked closely with UTM’s Department of Facilities Management and Planning, who collected the waste and recycling every Tuesday and Thursday and stored it in a secure place until the waste audit on Friday.
The waste was collected on Tuesdays and Thursdays because those were the days with the highest student traffic.
3. Conducted weekly waste audits.
A baseline waste audit was conducted using waste collected in the existing recycling bins in the two locations. Weekly waste audits were then conducted throughout the study to compare the effect of the recycling posters on the diversion rate.
During the audit, the waste and recycling bags were weighed and recorded. A visual audit was then conducted to assess the level of contamination in each stream and the amount of recyclable material collected. The waste diversion rate was then calculated using the following formula:
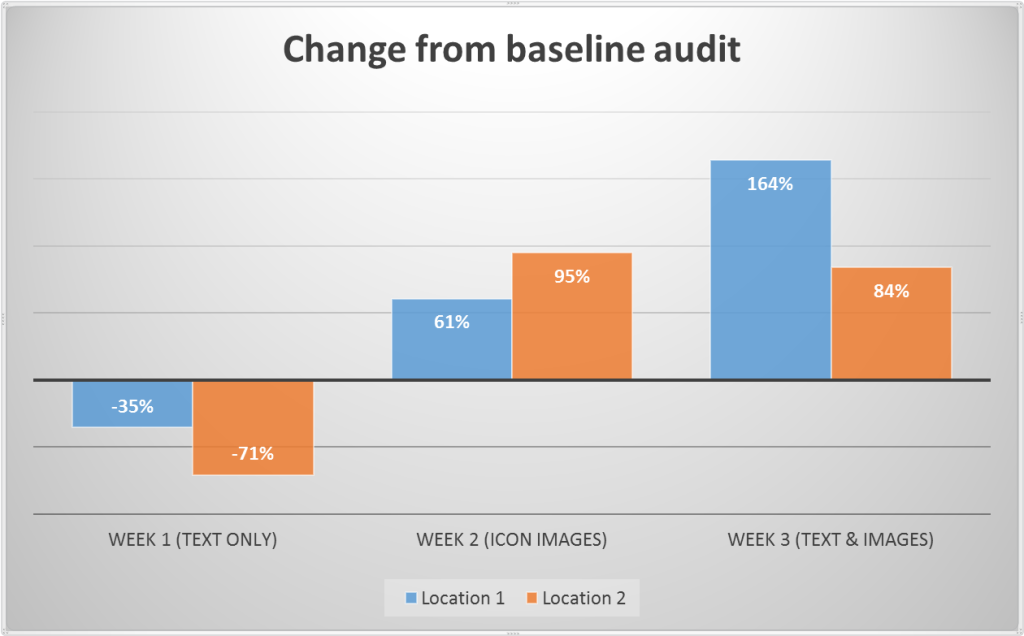
Study Results
Week 1 produced a decrease in diversion rate for both locations. This was due to the introduction of a different style of recycling container and graphics, with no prior communication to the students. Communication is critical in achieving user buy-in for a recycling program.
Week 2 showed a significant increase in diversion rate in both locations. The icons on the recycling posters helped people decide where to toss their waste.
Week 3, location 1 showed an increase of +164% in diversion rate with the addition of facility-specific waste images and text.
Week 3 Location 2 showed a slight decrease in diversion rate compared to week 2 but still considerably higher (+84%) than the baseline audit. The study attributed this slight decrease to the high level of contamination in the recycling stream from liquid left in coffee cups and other beverage containers. In these cases, the integrity of the recycling was compromised and these bags could not be classified as recycling and were instead put in the landfill waste.
The impact of recycling graphics.
This study confirms that images help people quickly determine into which stream they should toss their waste.
It also reinforces how important communication is to the overall success of a recycling program.
The CleanRiver 3C process incorporates Culture, Communication and Collection and is a holistic approach to implementing a successful recycling program. To learn more call us today at 1-888-646-4246 or email solutions@cleanriver.com.

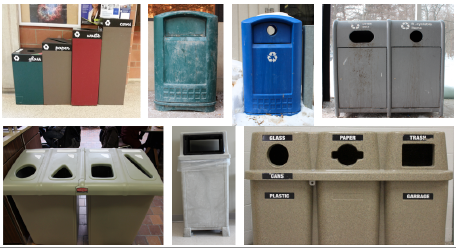 UTM’s campus recycling bins have text only stream labels.[/caption]
The study team planned to place two recycling containers at high traffic areas on campus. And change out the recycling bin graphics each week to see what impact this had on the campus diversion rate.
UTM’s campus recycling bins have text only stream labels.[/caption]
The study team planned to place two recycling containers at high traffic areas on campus. And change out the recycling bin graphics each week to see what impact this had on the campus diversion rate.


 Need help designing your recycling graphics? Take a quick look at our catalog of standardized recycling labels.